Phelps Laborshed
 A labor availability study was conducted by Kenneth M. Lemke, Ph.D. in 2013. He concluded that an employer offering attractive working conditions with competitive wages and employee benefits in Phelps County would be able to select from a substantial pool of applicants. In fact, the report states, "…a prospective new employer providing job opportunities with competitive wages and benefits and offering career opportunities would be a welcome addition to the employment base in Phelps County. The response to such employment opportunities would be substantial, and as this report shows, there is a sizeable labor force and population base living within the Phelps County Labor Area."
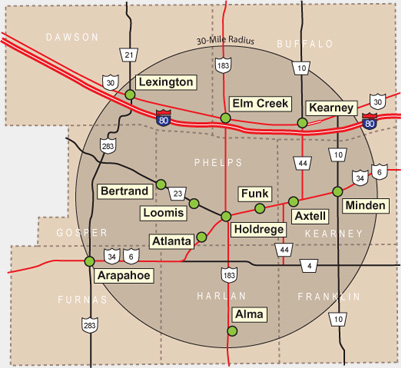
Employable Commuters: Phelps County's primary labor pool is drawn from the geographic area illustrated above. With minimal road congestion and convenient access to I-80, existing employers are able to attract qualified employees from a 40-mile radius: a commute time of approximately 45 minutes.
For more detailed information, download the Labor Availability Report.
Population
Population
| Population | 2000 | 2010 | 2023 | 2028 |
|---|---|---|---|---|
| Phelps Laborshed | 72,461 | 75,064 | 78,674 | 79,302 |
Source: ESRI, 2023-10-17
Population by Age
| Population | 2010 | 2023 | 2028 |
|---|---|---|---|
| 0-4 | 5,430 | 5,004 | 5,089 |
| 5-9 | 5,147 | 5,087 | 5,081 |
| 10-14 | 4,840 | 4,943 | 5,138 |
| 15-19 | 5,893 | 5,390 | 5,457 |
| 20-24 | 6,731 | 5,925 | 5,954 |
| 25-29 | 5,168 | 5,478 | 4,942 |
| 30-34 | 4,330 | 5,558 | 4,995 |
| 35-39 | 4,197 | 4,835 | 5,328 |
| 40-44 | 4,111 | 4,288 | 4,643 |
| 45-49 | 4,943 | 4,018 | 4,326 |
| 50-54 | 5,165 | 4,240 | 3,967 |
| 55-59 | 4,737 | 4,691 | 4,145 |
| 60-64 | 3,930 | 5,014 | 4,396 |
| 65-69 | 2,846 | 4,527 | 4,637 |
| 70-74 | 2,239 | 3,599 | 3,967 |
| 75-79 | 1,931 | 2,484 | 3,058 |
| 80-84 | 1,628 | 1,705 | 2,133 |
| 85+ | 1,800 | 1,889 | 2,046 |
| 18+ | 56,494 | 60,820 | 61,136 |
| Median Age | 35 | 37 | 38 |
Source: ESRI, 2023-10-17
Population by Race
| Phelps Laborshed | 2023 |
|---|---|
| Total | 78,674.00 |
| White Alone | 79.94 |
| Black Alone | 2.28 |
| American Indian Alone | 0.72 |
| Asian Alone | 1.13 |
| Pacific Islander Alone | 0.09 |
| Some Other Race | 8.74 |
| Two or More Races | 7.10 |
| Hispanic Origin | 17.30 |
| Diversity Index | 53.40 |
Source: ESRI, 2023-10-17
Growth Rate
| Phelps Laborshed | 2023 - 2028 |
|---|---|
| Population | 0.16% |
| Households | 0.27% |
| Families | 0.23% |
| Median Household Income | 2% |
| Per Capita Income | 2% |
Source: ESRI, 2023-10-17
Back To TopHousing
Households
| Population | 2000 | 2010 | 2023 | 2028 |
|---|---|---|---|---|
| Households | 27,186 | 29,206 | 30,782 | 31,201 |
| Housing Units | 29,949 | 32,221 | 33,952 | 34,339 |
| Owner Occupied Units | 20,385 | 20,990 | ||
| Renter Occupied Units | 10,397 | 10,211 | ||
| Vacant Units | 3,170 | 3,138 |
Source: ESRI, 2023-10-17
Home Value
| Phelps Laborshed | 2023 | 2028 |
|---|---|---|
| Median Home Value | $204,232 | $215,447 |
| Average Home Value | $242,848 | $256,499 |
| <$50,000 | 1,395 | 1,313 |
| $50,000 - $99,999 | 1,862 | 1,729 |
| $100,000 - $149,999 | 2,568 | 2,393 |
| $150,000 - $199,999 | 4,039 | 3,765 |
| $200,000 - $249,999 | 3,881 | 4,190 |
| $250,000 - $299,999 | 2,230 | 2,389 |
| $300,000 - $399,999 | 2,016 | 2,386 |
| $400,000 - $499,999 | 1,042 | 1,226 |
| $500,000 - $749,999 | 920 | 1,097 |
| $1,000,000 + | 183 | 219 |
Source: ESRI, 2023-10-17
Housing Year Built
| Year Range | Houses Built |
|---|---|
| 2010 or Later | 1,924 |
| 2000-2009 | 2,976 |
| 1990-1999 | 4,288 |
| 1980-1989 | 3,713 |
| 1970-1979 | 6,499 |
| 1960-1969 | 3,113 |
| 1950-1959 | 3,042 |
| 1940-1949 | 1,615 |
| 1939 or Before | 6,187 |
Source: ESRI, 2023-10-17
Back To TopIncome
Income
| Phelps Laborshed | 2023 | 2028 |
|---|---|---|
| Median Household | $67,259 | $75,806 |
| Average Household | $86,605 | $95,783 |
| Per Capita | $33,953 | $37,753 |
Source: ESRI, 2023-10-17
Household Income Base
| Phelps Laborshed | 2023 |
|---|---|
| <$15,000 | 2,476 |
| $15,000 - $24,999 | 2,877 |
| $25,000 - $34,999 | 2,279 |
| $35,000 - $49,999 | 3,405 |
| $50,000 - $74,999 | 5,700 |
| $75,000 - $99,999 | 4,674 |
| $100,000 - $149,999 | 5,632 |
| $150,000 - $199,999 | 2,564 |
| $200,000+ | 1,175 |
Source: ESRI, 2023-10-17
Back To TopEmployees
Commute
| Category | Commuters |
|---|---|
| Workers 16+ | 41,089 |
| In-County Residents | 33,563 |
| Out-of-County Residents | 7,338 |
| Drive Alone | 33,201 |
| Carpooled | 4,824 |
| Public Transport | 118 |
| Work at Home | 1,664 |
| Less than 5 minutes | 3,871 |
| 5-9 minutes | 11,161 |
| 10-14 minutes | 10,044 |
| 15-19 minutes | 4,367 |
| 20-24 minutes | 2,388 |
| 25-29 minutes | 1,285 |
| 30-34 minutes | 1,844 |
| 35-39 minutes | 407 |
| 40-44 minutes | 560 |
| 45-59 minutes | 1,724 |
| 60-89 minutes | 1,091 |
| 90+ minutes | 684 |
| Average Travel Time | 0 |
Source: ESRI, 2023-10-17
Source: ESRI, 2023-10-17
Employees by NAICS
| Category | Number |
|---|---|
| Total Employees | 47,553 |
| Agr/Forestry/Fish/Hunt | 667 |
| Mining | 16 |
| Utilities | 245 |
| Construction | 2,014 |
| Manufacturing | 5,970 |
| Wholesale Trade | 1,847 |
| Retail Trade | 6,667 |
| Motor Veh/Parts Dealers | 823 |
| Furn & Home Furnish Str | 139 |
| Electronics & Appl Store | 66 |
| Bldg Matl/Garden Equip | 530 |
| Food & Beverage Stores | 1,593 |
| Health/Pers Care Stores | 313 |
| Gasoline Stations | 161 |
| Clothing/Accessory Store | 689 |
| Sports/Hobby/Book/Music | 751 |
| General Merchandise Str | 1,602 |
| Misc Store Retailers | 0 |
| Nonstore Retailers | 0 |
| Transportation/Warehouse | 965 |
| Information | 1,429 |
| Finance & Insurance | 1,232 |
| Cntrl Bank/Crdt Intrmdtn | 691 |
| Sec/Cmdty Cntrct/Oth Inv | 192 |
| Insur/Funds/Trusts/Other | 349 |
| Real Estate/Rent/Leasing | 454 |
| Prof/Scientific/Tech Srv | 1,541 |
| Legal Services | 256 |
| Mgmt of Comp/Enterprises | 22 |
| Admin/Support/Waste Mgmt | 770 |
| Educational Services | 4,930 |
| HealthCare/Social Assist | 7,960 |
| Arts/Entertainment/Rec | 732 |
| Accommodation/Food Srvcs | 3,700 |
| Accommodation | 730 |
| Food Srv/Drinking Places | 2,970 |
| Other Srv excl Pub Admin | 2,913 |
| Auto Repair/Maintenance | 463 |
| Public Administration Emp | 3,293 |
Source: ESRI, 2023-10-17
Educational Attainment (25+)
| Phelps Laborshed | 2023 |
|---|---|
| Some High School | 2,295 |
| Graduated High School | 12,035 |
| Associates Degree | 5,498 |
| Bachelor's Degree | 11,339 |
| Graduate Degree | 5,439 |
Source: ESRI, 2023-10-17
Back To TopBusinesses
Businesses by NAICS
| Category | Number |
|---|---|
| Total Businesses | 3,720 |
| Agr/Forestry/Fish/Hunt Bus | 150 |
| Mining Bus | 4 |
| Utilities Bus | 17 |
| Construction Bus | 244 |
| Manufacturing Bus | 109 |
| Wholesale Trade Bus | 160 |
| Retail Trade Bus | 502 |
| Motor Veh/Parts Dealers Bus | 85 |
| Furn & Home Furnish Str Bus | 21 |
| Electronics & Appl Store Bus | 13 |
| Bldg Matl/Garden Equip Bus | 61 |
| Food & Beverage Stores Bus | 88 |
| Health/Pers Care Stores Bus | 49 |
| Gasoline Stations Bus | 21 |
| Clothing/Accessory Store Bus | 46 |
| Sports/Hobby/Book/Music Bus | 70 |
| General Merchandise Str Bus | 49 |
| Misc Store Retailers Bus | 0 |
| Nonstore Retailers Bus | 0 |
| Transportation/Warehouse Bus | 130 |
| Information Bus | 73 |
| Finance & Insurance Bus | 234 |
| Cntrl Bank/Crdt Intrmdtn Bus | 74 |
| Sec/Cmdty Cntrct/Oth Inv Bus | 58 |
| Insur/Funds/Trusts/Other Bus | 102 |
| Real Estate/Rent/Leasing Bus | 108 |
| Prof/Scientific/Tech Srv Bus | 234 |
| Legal Services Bus | 70 |
| Mgmt of Comp/Enterprises Bus | 3 |
| Admin/Support/Waste Mgmt Bus | 81 |
| Educational Services Bus | 109 |
| HealthCare/Social Assist Bus | 370 |
| Arts/Entertainment/Rec Bus | 96 |
| Accommodation/Food Srvcs Bus | 266 |
| Accommodation Bus | 59 |
| Food Srv/Drinking Places Bus | 207 |
| Other Srv excl Pub Admin Bus | 477 |
| Auto Repair/Maintenance Bus | 97 |
| Public Administration Bus | 236 |
Source: ESRI, 2023-10-17
Back To Top